Technical outline of the system
The software platform is built on the streamlined interaction between four underlying components: users and data sources (e.g. computers), classifications, data collection tools and, finally, results analysis, charts and dashboards.
The tabs bellow afford a better understanding of the mechanisms at work in each of these components.

Accounts affording access to the platform can be created for any member of the staff and for any individual affiliated with the organization. Each user, depending on the privileges granted to the respective user, can get a personalized overview of the project's status via dashboards, can access and analyze specific data, can gather data from various sources, and, if applicable, can fill out report forms, etc. Data gathering privileges, data access levels and the permission to perform administrative tasks are set at user groups level by the administrator.
Anonymous users or users for whom individual accounts cannot be created (e.g. stakeholders whose role in the organization doesn’t require them to have an account, or executives who are not likely to create an account) can also be included in the data collection mechanism, as surveys can be addressed in a variety of methods (including by simple e-mail links).
Data collection can also be conducted in the field, with no internet connection, for example by running on a Windows tablet the Client software, a proprietary software designed for both online and offline data collection.
If applicable, for certain data collection purposes, public access computers affiliated with the organization can be uniquely identified in the system (e.g. for surveys targeting purposes, or, if applicable, for anonymous activity statistics).
Classifications are criteria according to which all of the data, the document collections, the affiliated data sources (e-mails, computers, etc.), as well as the users, can be categorized. The predefined classification is geo-targeting, but it can be replaced or accompanied by any other type of classification that suits the organization’s structure and data analysis needs (e.g. departments, affiliation degrees, age, type of assistance received, scores in evaluation, etc.). Each user and each computer affiliated with the organization can be associated with one or more classification levels. Furthermore, when employing multiple classifications, cross-classification filtering is possible (e.g. target permanent employees under 25 from a specific department in a specific country)
Furthermore, privileges for user accounts can be set separately for various classification levels and, if necessary, users from certain levels can have access to data from the subordinated classification levels – for example, a region-level user can be granted access to the data submitted by all the locality-level users in the respective region. This mechanism not only allows data to be analyzed in a relevant manner, but it also facilitates the distribution of specific tasks to users affiliated with the organization, rather than over-burdening one central administrative user.
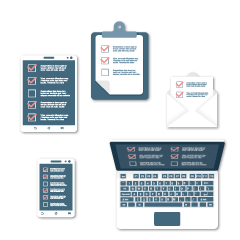
The system includes tools for both qualitative and quantitative data gathering. A separate feature facilitates, if necessary, the collection of anonymous data regarding the usage of the affiliated computers (e.g. power on time, in use time, idle time, etc.).
Besides the data collected using the internal tools of the system, data from other sources can be imported as well.
The main difference between the automated surveys and the online reports is that while the surveys are dedicated to automatically collecting anonymous data, the online reports are meant to be filled out by identified users (e.g. program staff). The system allows surveys to be published in a variety of forms - for example, survey can be configured to pop-up on affiliated public access computers when a set of customizable conditions are met, can be published to websites or can be distributed as links via e-mail messages. Unlike surveys, the online reports are precisely targeted at registered users, and to fill them in the respondents have to either log on or to follow a specific link (that can be sent via e-mail).
At the same time, the surveys can be used for interviews in the field, where no internet connection is available, by using a proprietary software.
Combining the available publishing methods, the impact assessment effort can reach any and all users and stakeholders affiliated to the project, along with members of the public.
The possibility to publish questionnaires either as surveys or reports provides the opportunity to ask the same question in different forms to different respondents, to best match their profile and thus raise the probability of receiving accurate answers.
Using the system, impact assessment can be conducted continually, periodically, occasionally or may even need just a one-time assessment. Due to the inherent flexibility of the system, any such request can be accommodated, customizing the whole process to fit any organization’s specific needs.
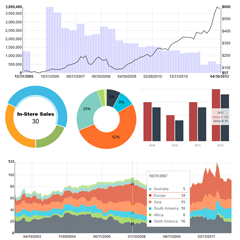
Data from the automated gathering tools can be visualized and analyzed in real-time, as data becomes available immediately upon submission, thus facilitating rapid trends detection and quick response.
Combining the various data-gathering methods that are available in the system not only allows both quantitative and qualitative analysis, but also facilitates cross-validation of the data.
The results can be visualized in raw format as tables or charts, or can be filtered and synthesized following configurable rules. For example, multiple successive filters can be defined (e.g. display only the answers from respondents with age 35+ who, for question 3 chose answer option B).
Analyzed data can be visualized in charts or can, on request, be used in GIS or other mapping solutions. Once created, the charts can be shared between users, even across the entire organization- this way, other users will be able to embed them in their own dashboards (or in other materials) and can even export them for print.
At the same time, certain data can be used for tracking specific sets of goals and for highlighting the degree of fulfillment for specific objectives.
On request, the constant automated monitoring of a predetermined set of metrics, accompanied by the multiple-source data collection mechanism, can be used to trigger warnings based on thresholds for the relevant metrics or based on the real-time evaluation of predefined correlations between specific metrics.
Users have access to one or more dashboards, and dedicated dashboards can be used to share up-to-date analysis results outside the organization (e.g. with the stakeholders).