Dashboards
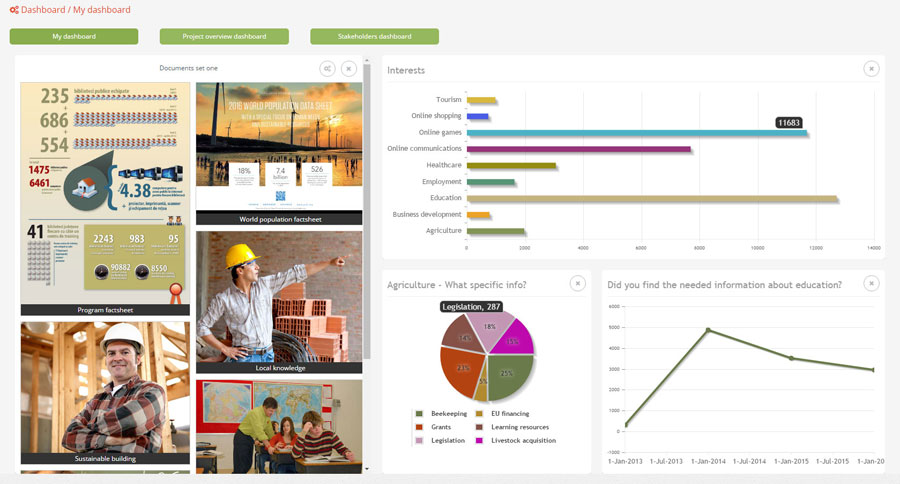
Dashboards are intended to make the most important data available at a single glance - each user can choose what is published on their customized dashboard, so that they can keep track of the critical information in real time.
All users can have access to one or more dashboards, containing charts and document collections. Users grated with specific administrative privileges can create dashboards to be shared with other users or even across the entire organization.
Dashboards can be used for sharing information even outside the organization - sometimes it is important to share real-time data with the stakeholders, be it for program implementation purposes or for demonstrating absolute transparency towards the funders. To this end, our system provides a special type of dashboard, which can be used for sharing details with external stakeholders that cannot be expected to go through a log-in procedure, but need to access specific charts (e.g. program funders, senior management, etc).
Cross filtering on any criteria and optional GIS mapping to help better data visualization are just some of the options we can provide upon request for informed decision making.
Info-graphics
Perhaps everyone needs, at a certain point, a document highlighting the most important program achievements organized in a friendly and easy to understand form, without intimidating tables. This specific need is addressed by our infographics-creation service, as users can request various formats for data visualization, each of which can be customized to serve the various management or communication purposes. We can help presenting the most relevant data in any shape, form or content type needed to demonstrate the impact of a project or program.